Recently I had the desire to start monitoring the statistics of our internet router. The main thing that I wanted to measure was the volume of traffic passing in from and out to the internet because the ISP limits the amount of data passing over the connection for each month. With a tool such as Cacti we can collect these statistics via SNMP and graph them in a fairly simple way. For details on how to set up an instance of Cacti on a CentOS Linux server go here.
Configure SNMP on Cisco Router
Go into global config mode:
cisco1# conf t
First we’ll set up read only access for a community string named “TestCommunity”. The community string functions like a password and only allows access for management stations configured with the same string name. Bear in mind that this value is passed over the network unsecured so do this only on private networks.
cisco1(config)# snmp-server community TestCommunity ro
For now Cacti will only need read access to get SNMP access stats. Make a note of the community string because we’ll need to configure the Cacti server with this later.
Optionally we can also specify some contact information and device information that can be gathered by Cacti:
snmp-server location Orange County, CA
snmp-server contact Aaron Walrath
snmp-server chassis-id cisco1
That should be all that is needed to get started. Additional steps are needed if you’d like to configure the router to send SNMP traps to Cacti to alert it of changes to the things such as the state of interfaces.
Configure Cacti to Collect SNMP Stats
Now it’s time to configure Cacti to collect information from the SNMP server on our Cisco router. Log in to the Cacti web console on you web browser:
Enter your Cacti admin user and password and click Login.
Under Management select Devices on the left.
On the right side select Add across from Devices.
Under General Host Options type in a Description and the fully qualified Hostname or IP address. Don’t click Create yet.
Now under SNMP Options, in the SNMP Version choose Version 2 from the dropdown list. Version 3 of SNMP is more secure and supports authentication and encryption, but for now we’ll use a more basic configuration. Notice the Downed Device Detection changes from Ping to SNMP. In SNMP Community type what you configured earlier on the router, again mine is “TestCommunity”. Now click Create.
Notice once we’ve saved this device in Cacti it now pulls in our SNMP information such as device uptime, location, and contact info. Now in the top right click “Create Graphs for this Host”.
Under Data Query a list of interfaces with statistics available via SNMP is show. My internet interface is FastEthernet0 (Fa0), so I’ll check the box next to it on the right. Then click Create.
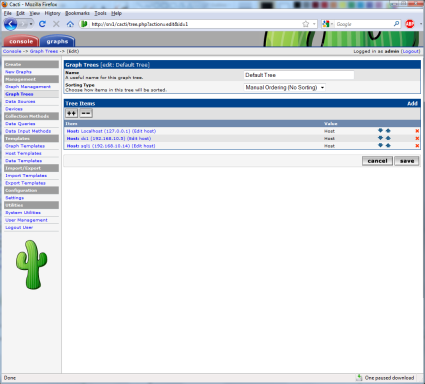
Click Default Tree in the center under Graph Trees.
Click Add all the way on the right from Tree Items.
Under the Tree Items heading for Tree Item Type select Host in the dropdown list. For the Host item below that select the descriptive name you entered for your router. Graphic Template should already be selected for Graph Grouping Style. Click Create.
When the save of the new host is successful it should be added to the list of tree items above. Under Management select Devices on the left side.
The router should be displayed in the list of devices that Cacti is monitoring. Initially my router Cisco1 has a status of Unknown.
Click refresh after a while and Cisco1′s status shows as Up. Now click the Graphs tab at the top left.
Under the Default Tree click the descriptive host name you gave your router on the left.
The graph(s) available for my Cisco1 router are shown. The statistics may take a little while to populate as they are collected.
After about 15 minutes I refreshed the page and got some traffic info. Click somewhere on the graph.
On this page I have several graphs representing traffic passing on my internet interface over various spans of time. As enough time passes the subsequent graphs will begin to populate with data. I’ve really only scratched the surface and much more customization of graphing and information gathering is possible with Cacti. Have fun!


